Demonstrateur
[1]:
import json
import numpy as np
from matplotlib import pyplot as plt
import seaborn as sns
from IPython.display import HTML
from oze.buildings.capt import CAPT
from oze.visualization import HistAnimation
%matplotlib notebook
# Switch to sns visualization and deactivate automatic plotting
sns.set()
plt.ioff()
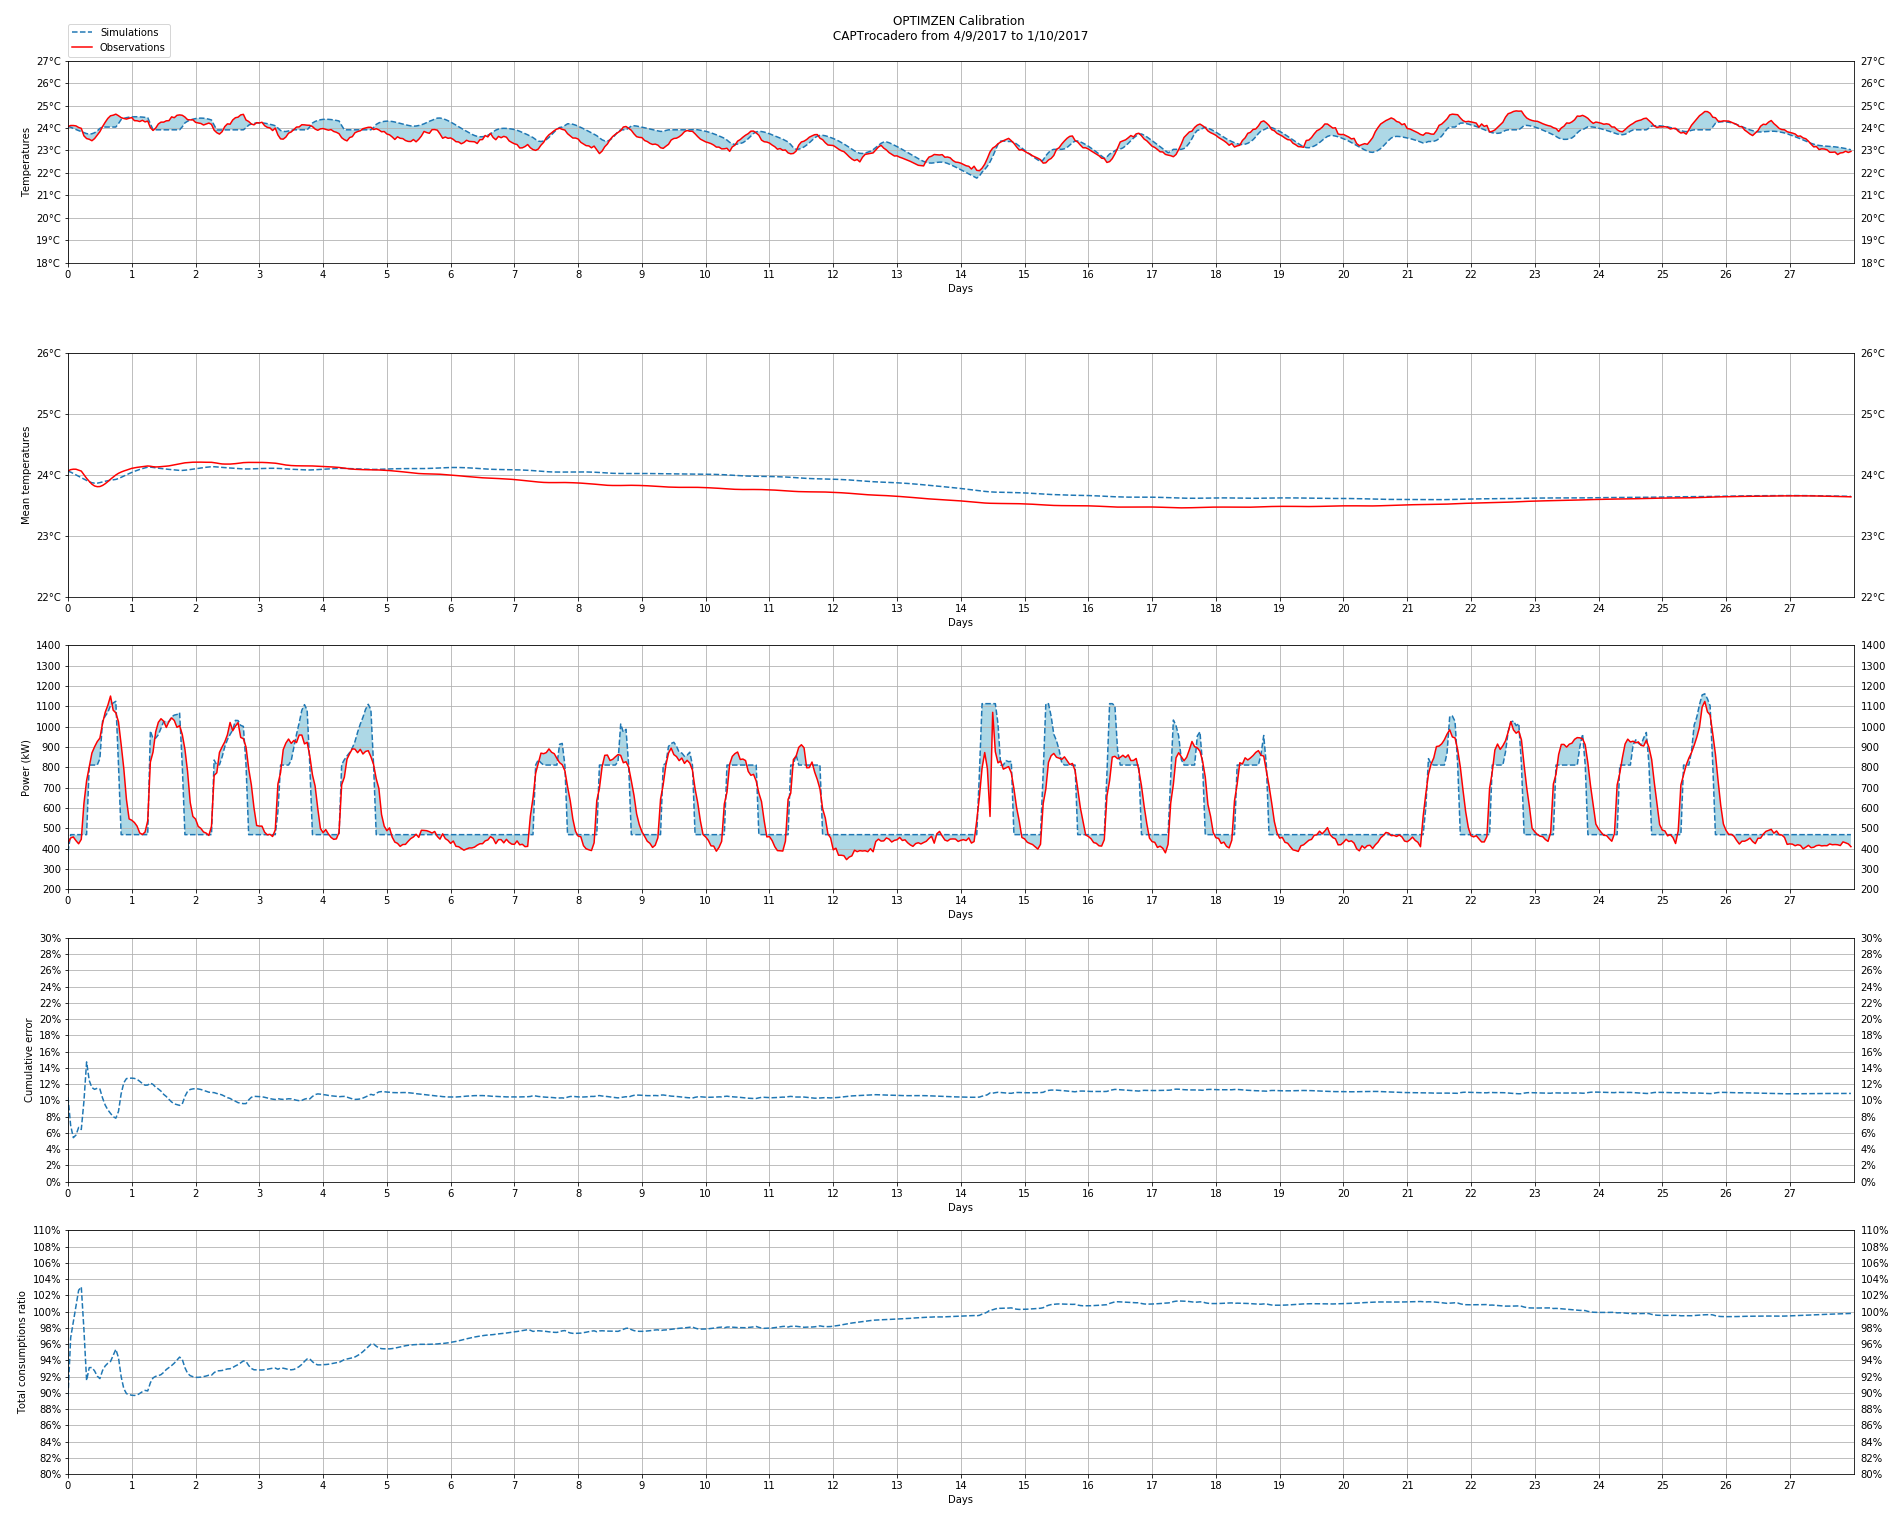
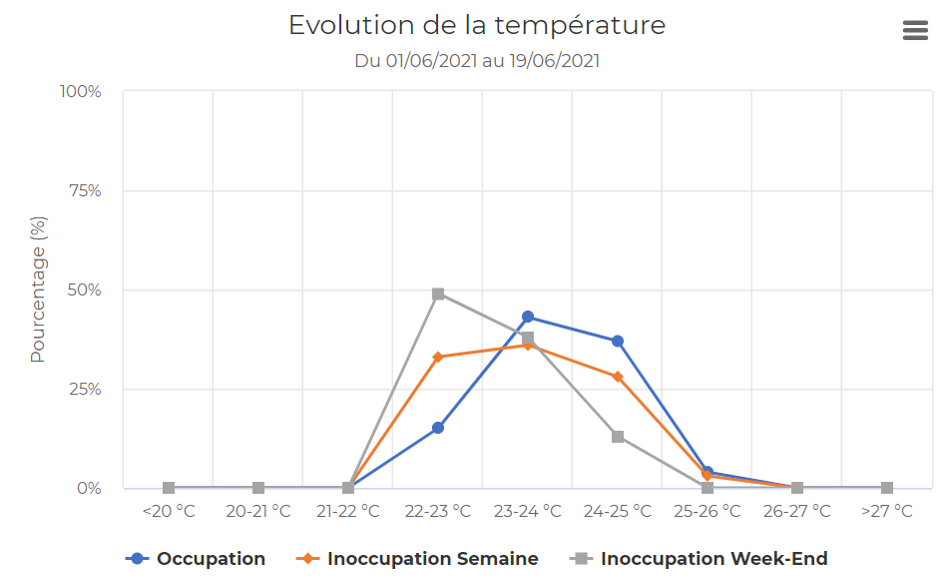
Température intérieure médiane
[2]:
animation = HistAnimation.load('animations/t_int.anim')
HTML(animation.run_animation().to_jshtml())
[2]:
Consommation totale
[3]:
animation = HistAnimation.load('animations/elec.anim')
HTML(animation.run_animation().to_jshtml())
[3]:
Erreur cumulée
Gestion de l’intermittence
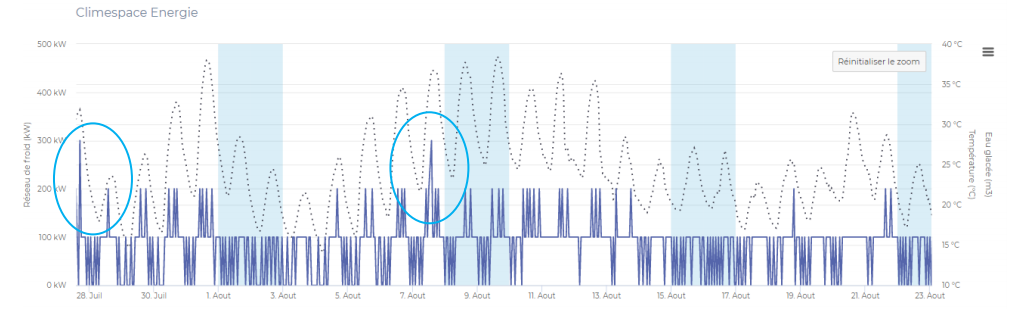
Optimisation de l’utilisation de Climespace
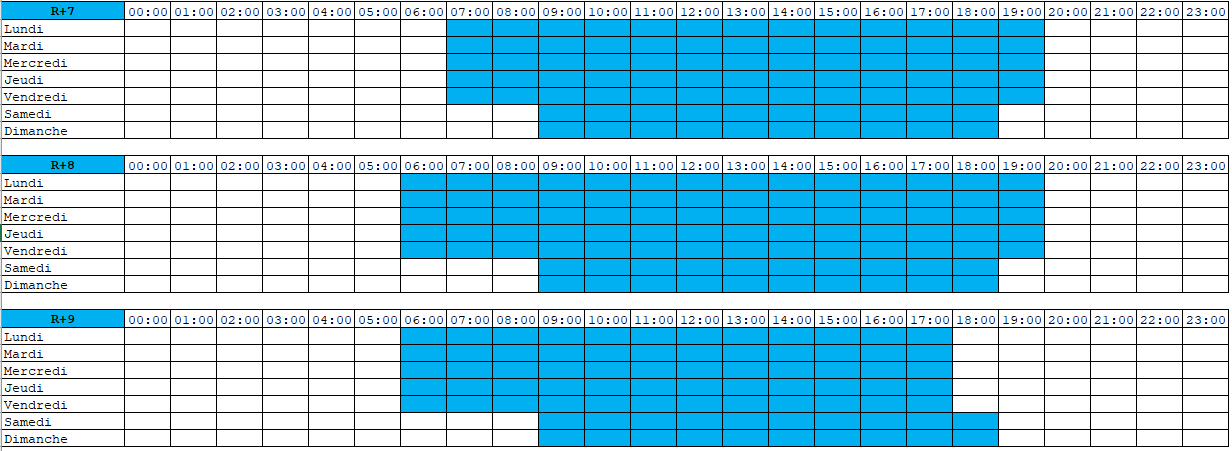
Optimisation de la programmation des Centrales de Traitement d’Air
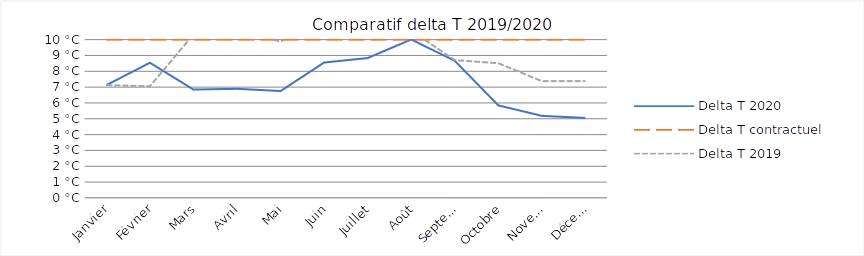
Feuille de Route, programmation saisonnière
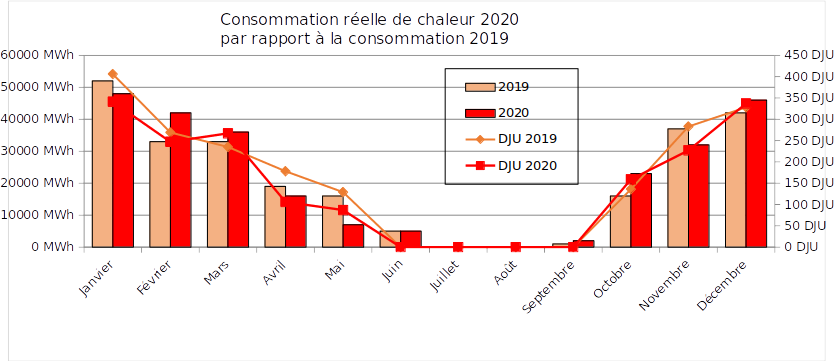
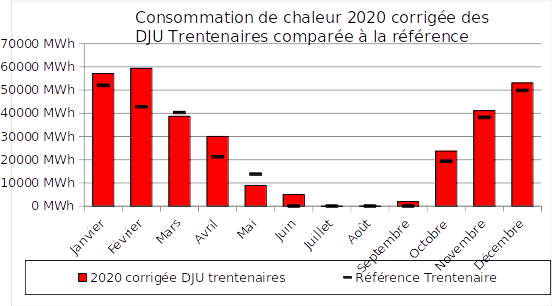
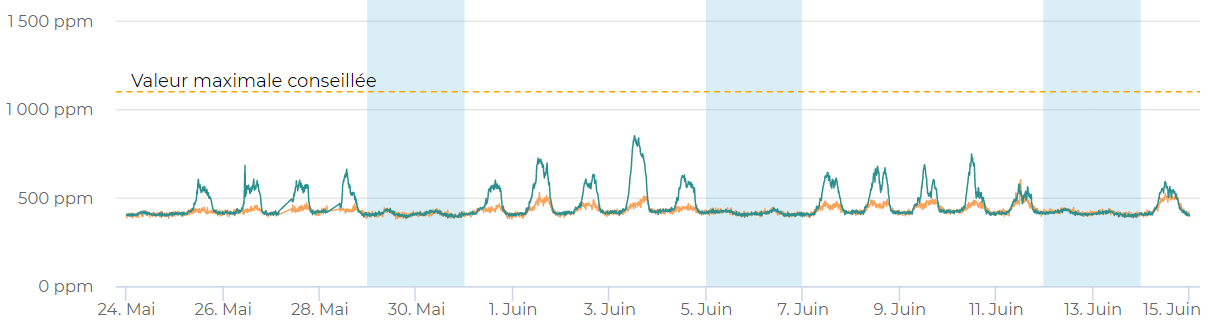
Consommations d’énergie thermique